This time around, I am not going to make the mistake by looking at the climatology for a particular day after said day occurs.
Fourth of July is a big holiday in the US and generally, a big outdoor holiday with parades, barbeques, concerts, and, of course, fireworks! Similar to the Memorial Day post, I thought it would be a good idea to take a quick look at the climatology for the 4th in Pullman. Data about general cloudiness is not easy to come by so there will not be any discussion about ‘cloudiness’ here. It is safe to assume that days with rain are also generally cloudy but data used here does not have any indications of general cloudiness. As such, the focus will be on precipitation and on temperature. I promise I do more than just look at Pullman’s temperature and climate data!
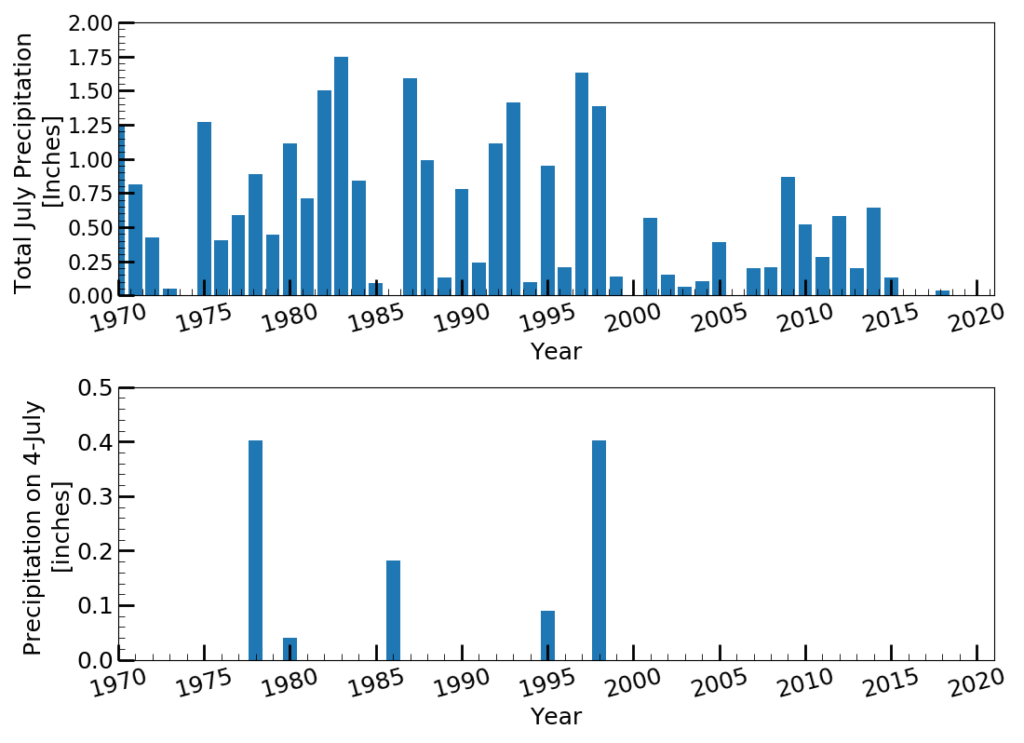
Anyway…it very rarely rains in Pullman on the 4th. The last year it rained on July 4th was 1998 with 0.40 inches of rain. Since 1970, it has rained on only five Fourths of July (See Figure 1, bottom panel). In general, Pullman gets very little rain in July (Figure 1, top panel). On average, July only sees about 0.6 inches of rain over the last 50 years. Since 2000, July has received only an average of 0.28 inches of rain. Summers around here are typically quite dry, so this is not surprising.


Figure 1. Cumulative precipitation for July from 1970 to 2018 (top panel) and total precipitation for July 4 from 1970 to 2018.
So, if it does not rain, do we get “too hot”? A few of the more recent Julys have been fairly hot but the average maximum air temperature for the whole month only reaches the low 80’s (82-83 Fahrenheit to be exact). The Fourth is only in the high 70’s (78-79F) but not uncommon to have days into the high 80’s to low 90’s, especially in the last few years (See Figure 2). The mean minimum temperature is just shy of 50F, quite a pleasant temperature for the middle of summer. This also brings the interesting issue of the general range of temperature swings in this area during the summer; something we will explore a little more in-depth in a near-future post.

Figure 2. Maximum, minimum, and mean temperature for July 4 from 1970 to 2018.
