This really should be been written before this week but the author didn’t think to write this until now.
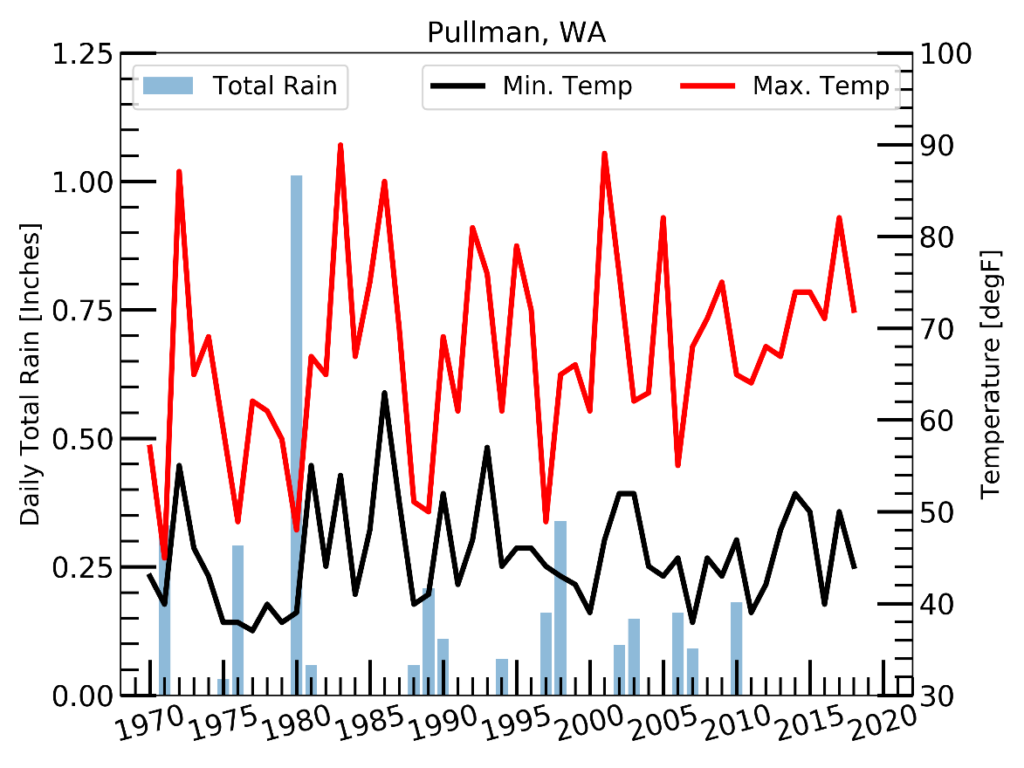
Memorial Day and the end of May marks a turn in the weather as we make the turn toward the summer heat and into the dry season in the inland Pacific Northwest. Growing up, my parents would say that Memorial Day was always a rainy day. This got me thinking (always dangerous) of how often it rains on Memorial Day and how warm does it get at the beginning of the summer. So, using data since 1970 (same data as the April precipitation post), how rainy has Memorial Day been in Pullman and where I grew up near Chicago, IL? The answer is not very, at least in Pullman. The rainiest Memorial Day in Pullman occurred in 1980 with over an inch of rain falling (See Figure 1, total daily rain are the bars and no bar means no rain that year). There was no rain on Memorial Day from 2011-2018. This year (2019), there was just a trace amount of rain, only a short sprinkle that wet the pavement. Of the 49 years, just 17 years had measurable rain, just a third of Memorial Days in the last 49 years had rain. On the days it did rain, the average precipitation total was 0.2 inches, more than just a sprinkle but not quite a deluge. To round this off, a quick check of the maximum and minimum temperatures over the past 49 years: the average minimum was 7.3 C (lowest min: 2.8 C) and an average maximum of 19.6 C (highest max: 32.3 C). These are reasonable for this area at the end of May and not bad grilling weather (provided it’s not one of the rainy years). This is a bit away from the “it always rains” sentiment.

Figure 1. Total daily precipitation (left axis) and daily minimum and maximum temperatures (right axis) for Pullman, WA from 1970-2018. Data for 2019 not plotted.
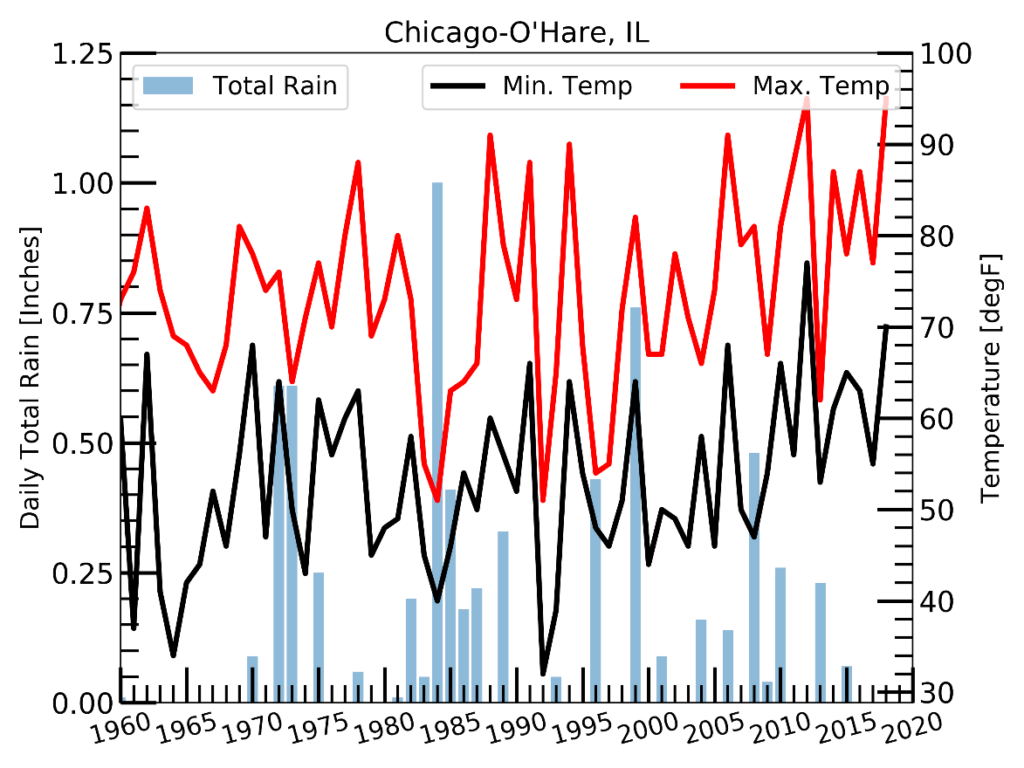
But I didn’t grow up in Pullman or anywhere nearby; I grew up 1800 miles east and a little south so let’s see how this holds up for area near my hometown. Using data from 1950 to 2018 from Chicago-O’Hare airport (nearest station with the longest, most complete data record), it rained on 43% of the Memorial Days which had data available, also, not quite “all the time”. However, the average amount of rain on days it rained was 0.27 inches, not a small amount of precipitation. It did rain every year from 1980-1986 and rained 9 out of 10 years from 1980-1989 (See Figure 2). There have not been the same long periods of dry Memorial Days around Chicago like there have been in Pullman; since 1969, the longest it went without rain on Memorial Day in Chicago was only 3 years. So, there is some truth to the frequency of rain on Memorial Day where I grew up. And yes, it did rain on Memorial Day this year, in fact there was a severe storm system that moved through the Midwest this year spawning numerous tornadoes and it has been quit a wet spring for the Plains and Midwest states. However! In the end, “rain every year” is a bit of hyperbole, but even parents are wrong sometimes (sorry Mom and Dad!). This is what happens when you talk about weather and climate with your son who grows up to be a meteorologist 😊.

Figure 2. Total daily precipitation (left axis) and daily minimum and maximum temperatures (right axis) for Chicago-O’Hare airport, IL from 1970-2018. Data for 2019 not plotted.
